
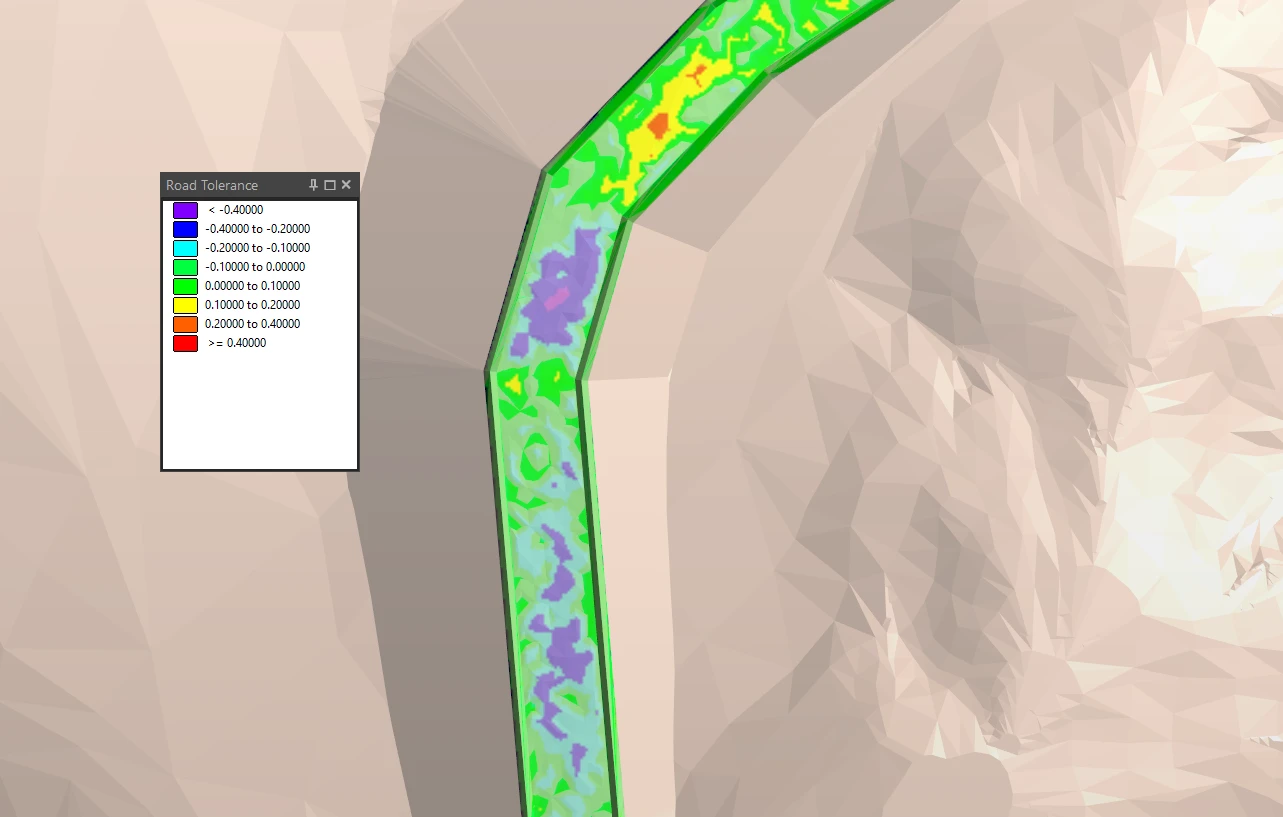
Every once in a while, I revisit work I used to do and see whether I can repeat it in the mining software I’m using now, just to keep my mind sharp. This time, I’m looking at road conformance heatmaps in Micromine Beyond.
At the time of writing, I’d been using Micromine Beyond for roughly a year, and it had treated me quite well. I’d replicated many old workflows with a Micromine flavour, although I encountered a few obstacles along the way. Below, I revisit a historical road conformance workflow, explain how I reproduced it and share two ways to work around the heatmap display limitations.
What are road conformance heatmaps?
Road conformance heatmaps compare surveyed topography with a road design surface and use colour to show the differences. They help teams identify high and low areas along a haul road or ramp. The workflow below calculates these differences and displays them as coloured points, a draped grid or a georeferenced image.
Why audit haul road gradients and ramp condition?
Around 2015–2017, road and ramp conformance became a critical safety issue following several incidents involving runaway trucks. One of the key actions from the investigations was to conduct regular audits of ramp gradients and ramp condition.
Although those specific safety risks had since been addressed, the road conformance workflow stayed with me.
The original road conformance workflow in Vulcan
From memory, the survey team used the following workflow in Vulcan:
- Create constrained surfaces or digital terrain models (DTMs) of the road design/sheeting file and the surveyed topography.
- Use the Triangle Surface/Utility command to calculate the distance between the topography and the road sheeting file.
- Add the distance attribute and values to the road sheeting file, then colour the surface using compliance thresholds, such as ±0.2 m.
- Digitise the ramp laneways and divide them into 100 m segments to reduce noise when auditing gradient compliance.
This creates a heatmap overlaid on the road design, helping teams identify excessive high and low spots and manage ramp integrity. It can be particularly useful after the wet season.
How to create road conformance heatmaps in Micromine Beyond
The workflow can be replicated in Micromine Beyond as follows:
- Create surfaces/DTMs using Grid/DTM > DTM Create > Create Interactive and select your designs. Use clipping polygons to constrain the surfaces.
- Use Grid/DTM > DTM Tools > Seam Thickness to calculate the distances between the topography and the road sheeting file.
- Set the Roof DTM to your Road Sheeting Design and the Floor DTM to your topography.
- In the Output tab, output a Thickness Points file and define a reasonable X/Y Spacing.
- Use Grid/DTM > DTM Tools > Generate Z Values. Select your Road Design DTM and your Thickness Points file.
- Load your Thickness Points file with a legend showing the compliance thresholds.
Limitations of a point-based heatmap
This produces a heatmap similar to the Vulcan workflow, with two limitations:
- Visibility when zooming in: the heatmap uses colour-coded points, which appear more spread out as you zoom into the design. The Vulcan workflow could colour the surface itself using the distance values.
- Performance over large areas: displaying a large number of points can cause performance issues. Increasing the grid spacing can improve performance, but it reduces the heatmap’s resolution.
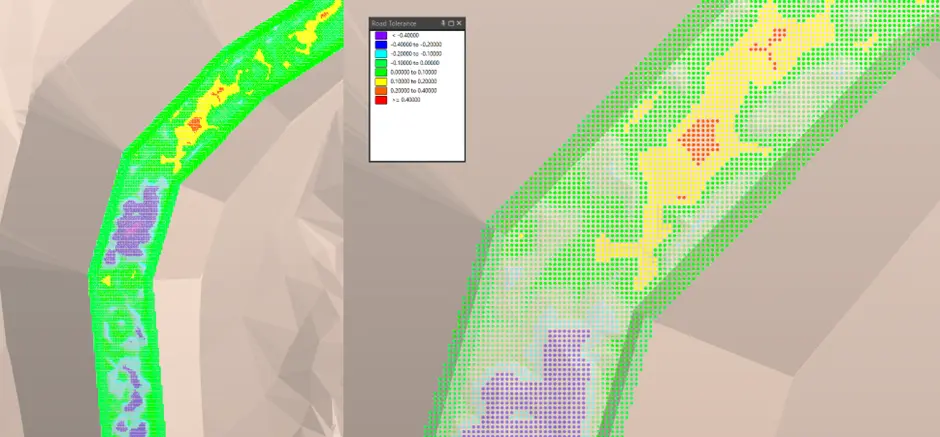
There are two ways to work around these resolution and display limitations: grid draping and georeferenced image draping.
Solution 1: Convert a Thickness DTM to a grid for draping
When using Grid/DTM > DTM Tools > Seam Thickness, you can generate a Thickness DTM instead of a points file.
- Micromine Beyond generates a DTM in which the height differences between the road design and topography replace the surface’s Z values.
- Use the Thickness DTM to create and apply the colour legend for your heatmap.
- Use Grid/DTM > DTM Convert > DTM to Grid to convert the Thickness DTM to a grid/raster file.
- Open the formset/settings for your road design surface.
- Go to the Draping tab and enable the Grid radio button.
- Select your converted grid file and the associated colour legend.
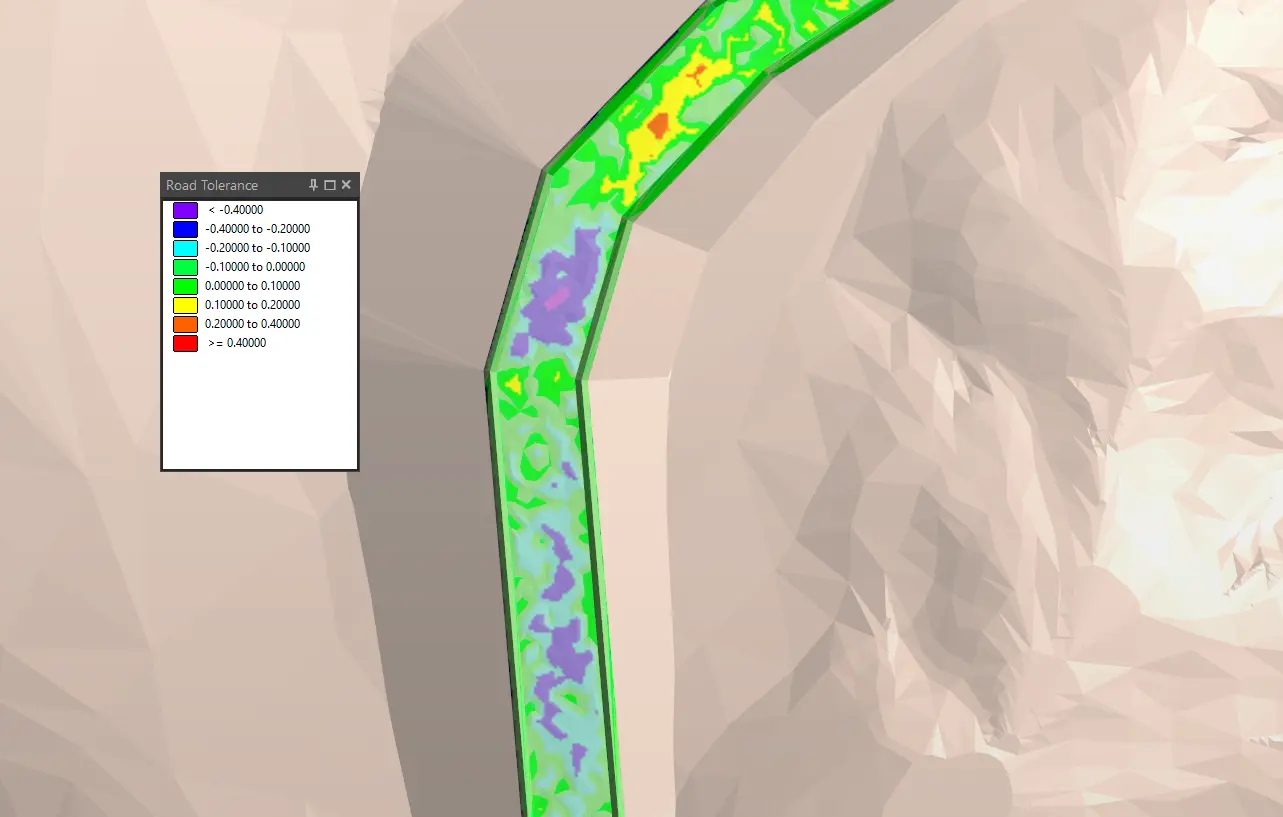
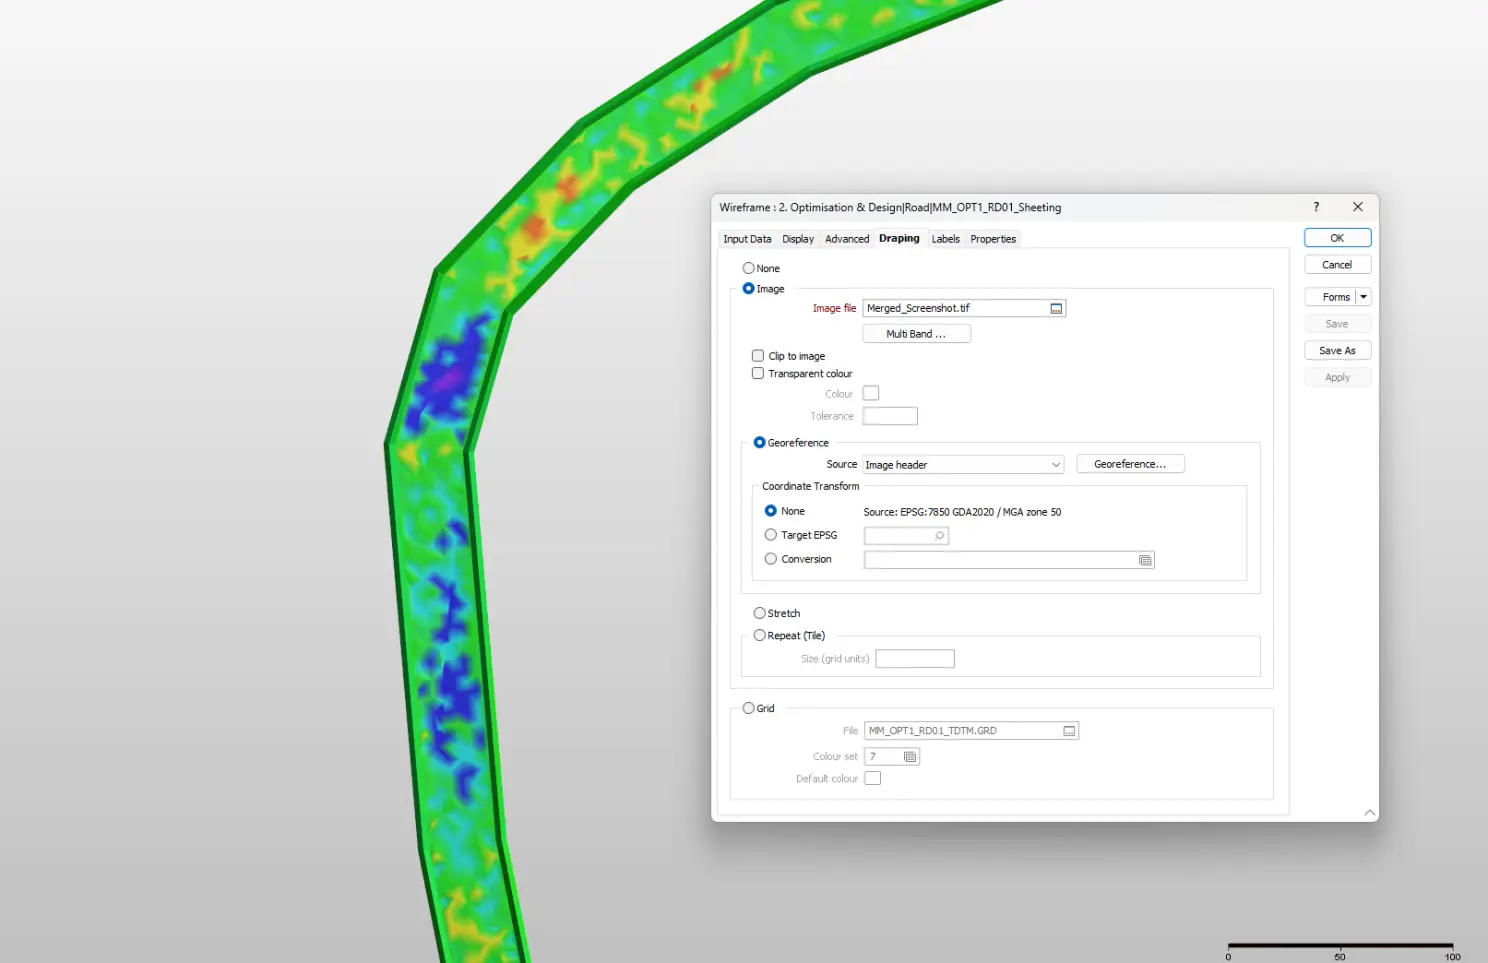
- The road design surface should now be coloured and textured with the heatmap, as illustrated in Figure 1.
This provides the desired heatmap resolution. In the software setup used for this workflow, however, an additional module was required to convert DTMs to grid files. The next solution offers an alternative.
Solution 2: Create georeferenced screenshots for image draping
Micromine Beyond can generate georeferenced screenshots of the Thickness DTM heatmap. These can be combined, if required, into a high-resolution image and draped onto the road design surface.
- If the road design fits on one screen, zoom to its full extent and use Vizex > Capture > Generate Screenshot.
- Set the background colour to transparent. Disable the grid, scale bar and orientation HUD.
- Select an appropriate DPI, enable the georeferencing coordinate system checkbox and save the image as a GeoTIFF.
- Open the formset/settings for your road design surface. In the Draping tab, select the Image radio button.
- Select the generated GeoTIFF and enter the coordinate transformation, if required.
If the ramp design is too extensive to capture clearly in one screenshot, take multiple screenshots and combine them using File > Image > Merge Georeferenced Images. The merge command can handle overlapping images.
How to automate georeferenced screenshots with a macro
When you need more precise control over the display extents, you can configure a Micromine macro to automate the repeated screenshot tasks.
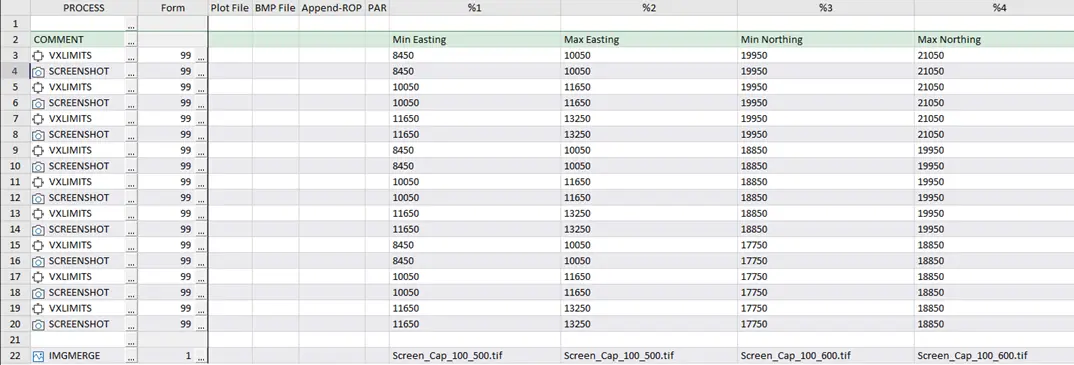
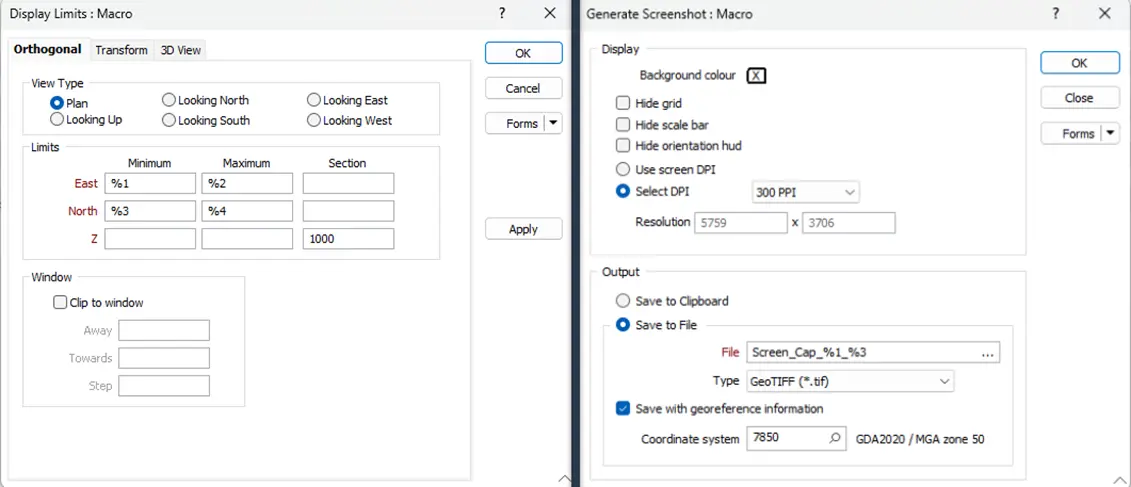
In the macro shown above:
- VXLIMITS uses substitution variables in columns %1–%4 to define the viewing extents: minimum easting, maximum easting, minimum northing and maximum northing, respectively.
- SCREENSHOT runs the equivalent of Vizex > Capture > Generate Screenshot. It is configured to append the minimum easting and northing to the output filename.
- The merge step, shown as IMGMERGE in Figure 3, combines the generated georeferenced screenshots.
The idea is to define a set of grids or display extents horizontally and vertically, generate the permutations of minimum and maximum eastings and northings, then use VXLIMITS and SCREENSHOT to capture a georeferenced screenshot in each grid.
Using Excel VBA—or whatever your vibe-coded weapon of choice is—you can generate these permutations in a format that can be copied into Micromine’s macro editor.
VBA code, Excel sheet and screenshot macro
For the VBA permutation generator, Excel sheet and screenshot macro, send an enquiry to cnguyen@orepath.com.
Where this historical workflow can still help
The last time I encountered this workflow was in 2020 at Paraburdoo, while working for my client, MinRes / CSI Mining. We were discussing haul road maintenance within our work area and the relevant compliance standards. I’m not sure whether the workflow is still being used, given the time that has passed.
Nevertheless, revisiting it helped address an issue that users in the exploration space had raised several times: georeferenced screenshots in Micromine being “too low resolution”.
Drones can now capture high-resolution images along programmed flight paths and automatically stitch georeferenced images together, with much better integration between topographic scanning and aerial imaging. If your equipment or software is limited, however, this workflow may still offer a practical way to produce and display road conformance heatmaps.