

Check haul truck configuration before mine scheduling begins. A profile can have the correct truck name and payload while using rimpull curves, braking curves or axle weights from a different model. These mismatches can distort travel time predictions and flow through to production schedules and fleet requirements.
This is an issue I have seen many times. For example, a truck might be labelled CAT777 and use a 90 t payload, but have the performance curves, weight distribution and braking curves of a different model, such as KOM830E. The mismatch can go unnoticed because truck profiles are often configured once and rarely revisited.
This article explains how to check truck profiles against manufacturer data, what a misconfigured truck can do to a schedule, and why payload and braking assumptions also deserve attention.
How do haul truck configuration errors happen?
In Alastri, configured truck names identify the trucks used in the scheduling workflow. An incorrect or misleading name can therefore hide a mismatch between the selected truck and its underlying parameters.
In the Alastri setup I have used, the option to add a default truck uses performance curves based on an older CAT777. A user may add that default truck and rename it to the required model without realising that the performance and braking curves also need updating.
Every haulage model is an approximation of operating conditions. Errors in the truck setup widen the gap between the model and reality, reducing the reliability of travel time predictions.
How to check haul truck profiles against OEM data
Compare the configured truck’s payload, axle weights, rimpull curve and braking curve with the original equipment manufacturer’s (OEM) handbook for the correct model. Checking the profile name alone is not enough.
The key checks are:
- Truck identity and payload: confirm that the profile represents the intended truck model and payload.
- Rimpull curve: compare the digitised force-versus-speed curve with the correct OEM curve.
- Braking curve: confirm that the braking or retard curve belongs to the same truck model.
- Axle weights and weight distribution: check the weight over the drive wheels, including the loaded and empty values used by the model.
- Units and digitisation: check that values copied or converted from the handbook use the correct units.
These inputs contribute to acceleration calculations and the model’s checks on whether a truck can traverse a route. The precise calculation logic depends on the software.
Comparing rimpull curves: a practical example
Once you have the correct OEM handbook, compare its curves with those displayed in the software. A significant difference is a reason to investigate the truck configuration.
In Figure 1, the OEM curve shows more than 1,000,000 N of force available at the drive wheels at 0 km/h. The digitised curve on the left shows 84,182 kgf, equivalent to approximately 825,825 N using the conversion below:
84,182 kgf × 9.81 ≈ 825,825 N
This discrepancy strongly indicates a mismatch in the truck model configuration. It also shows why the units need to be checked before comparing curves.
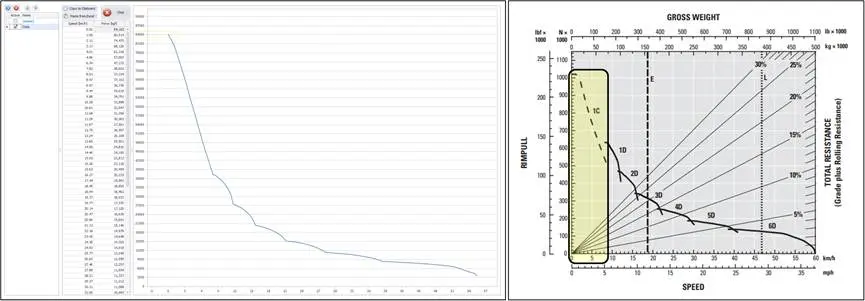
Performance curves are generally displayed in similar formats across haulage software, so this comparison can be applied in different systems.
How misconfigured trucks affect mine scheduling
Incorrect truck curves can significantly affect scheduled production and fleet requirements. To demonstrate this, I deliberately applied the performance curves of a 250-tonne truck to a 150-tonne truck model and ran the comparison in the Orepath Mining Simulator.
Over four shifts, the misconfigured truck moved approximately 16% more material than the correctly configured version. This was a result from that specific simulation, illustrating how a configuration error can produce an overly optimistic haulage forecast.
Although the comparison covered a short period, a similar modelling error carried into a life-of-mine schedule could distort the plan and its fleet requirements. Fuel consumption estimates could also be affected where they form part of the scheduling outputs.
In this example, the smaller truck model uses the larger truck’s performance curves, giving it a higher modelled power-to-weight ratio than it should have. Because our simulator calculates rimpull dynamically based on the actual payload, the misconfigured truck appears to accelerate faster and achieve shorter travel times.
Why rimpull calculations may not reflect the actual payload
Vendors apply performance curves differently within their haulage calculations. In some systems, the payload entered for scheduling is separate from the weight used to calculate travel time.
A fixed drive-axle weight may be assigned during truck setup, typically using the OEM’s loaded weight and rear weight distribution. That setup value is then used to determine available traction and acceleration during the haul.
The actual payload may be specified elsewhere and vary with the material being hauled. The drive-axle load implied by that payload can therefore differ from the fixed setup value, potentially producing inaccurate haulage performance estimates in extreme scenarios.

How are braking curves used in haulage calculations?
Braking curves can serve different roles in a haulage model. They may be used for route validation, helping the software assess braking capability against a segment’s gradient. A warning such as “truck can’t safely traverse segment” can be associated with these checks.
Route validation and the calculation of deceleration are related, but they should not be assumed to use identical logic. In a calculation that applies a fixed deceleration rate—for example, 1.5 km/h per second—that rate does not necessarily represent the truck’s braking response across different gradients, gears and operating conditions.
However, a configured deceleration rate does not by itself mean braking curves are excluded from travel time calculations. For example, Haul Infinity’s calculation documentation describes rimpull and retard curves being used subject to acceleration, traction and retarder limits. Check how these inputs interact in the software and version you use.
In my view, a desire to maintain consistency with older haulage calculations can make changes to modelling assumptions difficult. Results that differ from familiar systems may attract questions, even when the underlying approach is more realistic. That makes understanding the calculation method just as important as checking the input curves.
Check truck profiles before scheduling begins
If you have not checked your truck profiles recently, revisit them before the next scheduling run. Confirm that the truck name, payload, performance curves and axle weights all describe the intended configuration.
Imported rimpull and braking curves deserve the same scrutiny. Someone has converted the OEM handbook curves into digital data, and that manual process can introduce mistakes.
Small truck setup errors can become significant planning errors. Checking the profiles early helps prevent those mistakes from carrying through the haulage model and into the mine schedule.