
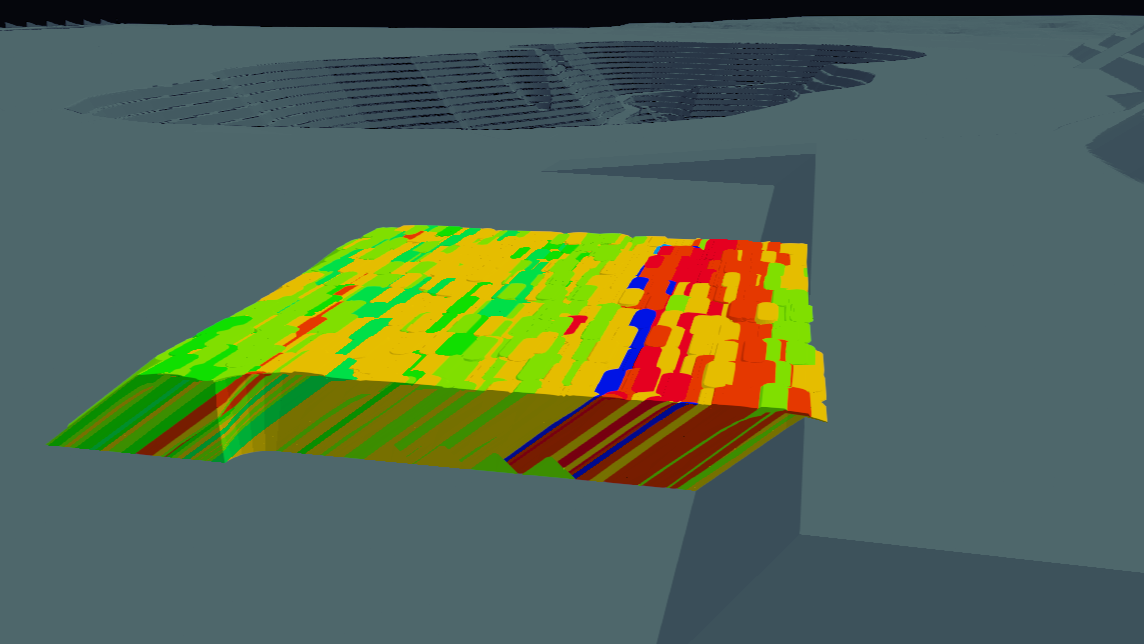
A common and persistent challenge in mining operations is managing variability when blending material from run-of-mine (ROM) stockpiles. As a graduate mining engineer working in grade control and two-week planning, I often saw stockyard builds go off-spec because predicted ROM stockpile grades differed from the actual grades. Never on my watch, of course… 👀 The consequences included costly penalties.
Grade is only part of the story. Mineralogy, hardness, clay content and moisture also affect crusher and plant performance, including comminution efficiency, throughput, flotation response and recovery. Predicting the material expected in the feed helps the plant prepare to process it effectively.
At Orepath, we began developing a tool to help engineers manage ROM stockpile blending and feed variability using existing hardware and site systems. Similar concepts have been explored in academic research; our focus is on turning the approach into something practical and usable on site.
This article looks at the limitations of existing stockpile tracking methods and explains our proposed 3D stockpile modelling approach.
What is 3D stockpile modelling?
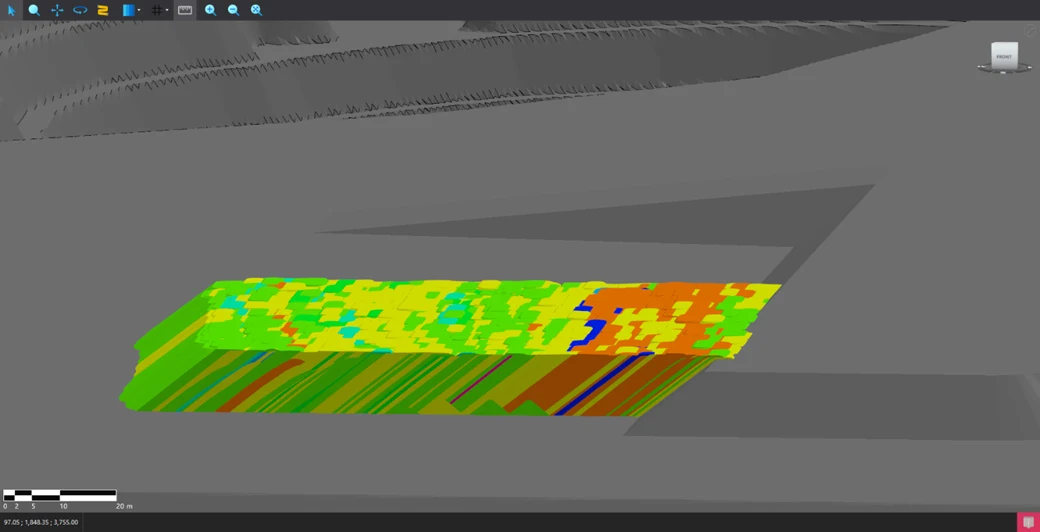
3D stockpile modelling represents where material is placed and reclaimed within a stockpile using X, Y and Z coordinates. The approach described here uses individual truck dump locations and material attributes to model stockpile builds and estimate the properties of reclaimed feed.
Existing stockpile tracking methods and their limitations
Two common approaches to tracking stockpile material are LIFO/FIFO lists and 2D grids. Both have their uses, but each has limitations when representing the material’s spatial distribution.
LIFO/FIFO lists: tracking loads without spatial resolution
Last-in, first-out (LIFO) and first-in, first-out (FIFO) lists record each truck dump as an entry containing its payload and associated attributes, such as grade. They do not record how those loads are distributed spatially within the stockpile.
When material is reclaimed, a target tonnage is specified and entries are removed sequentially from the appropriate end of the list. The output grade is calculated as a weighted average of the reclaimed entries.
Because the method does not account for the actual location of material, its predictions can differ from the feed being reclaimed, affecting feed quality estimates and reconciliation.
2D grids: adding location, but missing vertical layering
A 2D grid introduces spatial awareness in the X and Y dimensions. The stockpile footprint is divided into cells, and each truck dump is assigned to a cell based on its dumping location. Material properties and tonnage are aggregated within each cell, with weighted values representing that area’s blended composition.
This improves on list-based tracking, but it lacks resolution in the Z dimension and can misrepresent how material settles. Material does not simply land and remain where it is dumped, paddock dumps aside. It flows, compacts and forms slopes aligned with its angle of repose. In practice, stockpiles build more like stratigraphic layers, shaped by material flow and tipping behaviour.
For perspective, a simple stockpile slope with a 10 m vertical height and a 37° angle of repose has a horizontal crest-to-toe distance of approximately 13.3 m. Material tipped over the edge flows downhill and disperses across that distance. Treating it as though it stays within rigid vertical grid cells creates a disconnect between its physical placement and its modelled location, reducing the reliability of reclaim predictions.
Why smaller grid cells do not always improve accuracy
Grid size introduces a trade-off between spatial resolution and modelling accuracy. Because material properties are aggregated within each cell, the predicted average grade represents reclaiming the entire cell. Partial reclaim carries uncertainty because that average does not describe the variability within the cell.
Depending on the system’s logic, reducing cell size may not improve the representation of material behaviour. Without suitable logic for flow and settling, such as rill angle and tipping behaviour, smaller cells can capture less of the actual dumped volume. Finer grids may therefore introduce more noise and an illusion of precision while diverging further from physical reality.
How Orepath’s proposed 3D stockpile model works
Our approach uses the X, Y and Z coordinates of individual truck dumps to represent material placement and reclaim more realistically. We have pursued a practical model using GPS data captured by existing hardware on haul trucks.
Modelling stockpile builds from individual truck loads
For stockpile builds, each truck load is treated as a discrete volume placed at its estimated location, whether paddock-dumped or tipped over a face. The approach accounts for factors including truck size, rill angle, underlying material, GPS antenna offsets and dozer push effects.
It does not eliminate every source of error. However, we believe it provides a more spatially realistic representation of how material settles, offering a stronger foundation for operational decisions and downstream planning than a 2D representation.
Modelling reclaim with configurable removal geometries
For reclaiming, the model uses configurable removal geometries to represent different types of equipment. For example, an inverted cone can represent a front-end loader bucket or a draw point.
The model calculates feed properties by evaluating the individual dump solids intersected by the removal geometry. Each contributing block is weighted by volume, producing an estimate of the reclaimed material. This approach more closely represents equipment movement and the material it encounters, with the aim of improving feed predictions.
The model does not need to be as granular as sand—pun intended—to be effective. Beyond a certain level of detail, modelling every grain adds complexity and computational overhead without significantly improving accuracy. The aim is to capture key behaviours, such as angle of repose and layering, while keeping the model efficient, quick and usable. It is better to be roughly right than precisely wrong.
Potential benefits of 3D stockpile modelling
We see several potential benefits for ROM stockpile management, feed planning and reconciliation.
Greater confidence in feed decisions
Visualising material placement in three dimensions, with a reasonable degree of spatial accuracy, can give engineers and operators greater confidence in feed decisions. I recall several occasions when we were scrambling to locate specific material to bring a build back within tolerance.
Those decisions need to be made quickly. A tool that shows material distribution and allows the stockpile to be shaded by attributes such as grade, moisture or material type would have been invaluable.
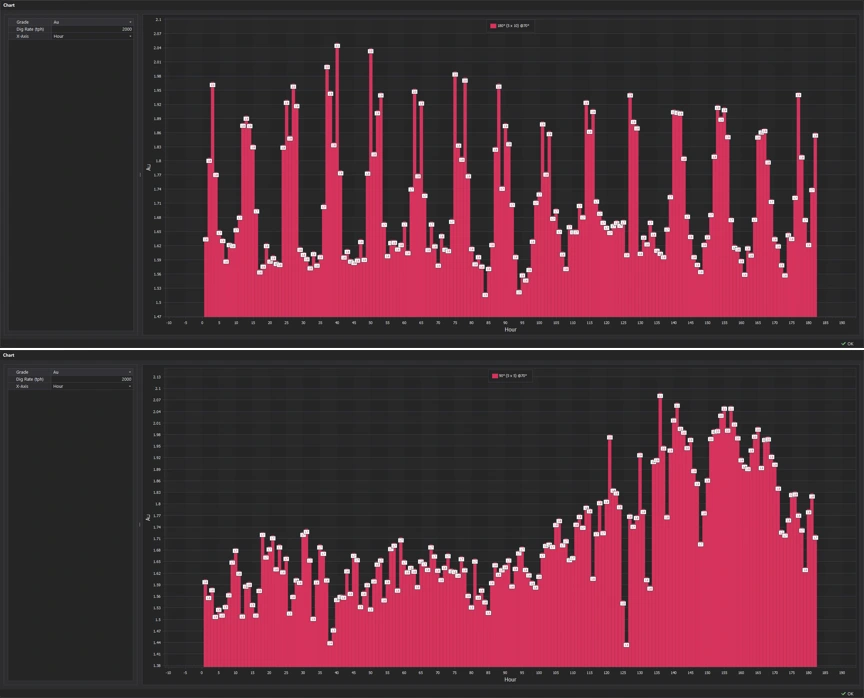
Predicting feed grade and material variability
Modelling where individual dumped loads sit can support better predictions of feed grade, material handling properties and geological characteristics. These include contaminants, moisture, hardness and clay content, which can affect crusher performance, plant throughput and recovery.
Simulated dig paths can help anticipate how the feed profile will change during reclaim. That visibility can help reduce operational surprises and support more consistent plant performance.
Supporting short-term and two-week mine planning
Two-week planning often relies on weighted average stockpile grades. This can work for small or uniform builds with limited variability, but it becomes less reliable for extensive stockpiles built over multiple days.
A 3D model offers the potential to import stockpiles as pit solids, giving planners a more spatially accurate starting point for grade forecasts and improving confidence in plan outputs.
Improving material traceability and reconciliation
With suitable hardware, such as bucket-mounted GPS, or consistent site processes, such as daily survey pickups, the approach could help trace reclaimed material back to its origin with greater spatial accuracy.
That traceability could support reconciliation by helping link plant assays to specific mining areas. This is difficult when stockpile reclaim is represented by broad weighted averages that obscure material origin and variability.
Data requirements and limitations
The framework could be extended to long-term stockpiles or combined with an optimiser to support decisions. Its effectiveness, however, depends on the systems, hardware and data available on site. The approach is not universally applicable.
Haul truck GPS accuracy
At a minimum, sites need GPS tracking on haul trucks, ideally with high precision. Lower-precision data could still be used, but it introduces uncertainty in dump locations. Post-processing corrections may be possible in some cases, although the required data is not always available or reliable.
Linking grade blocks to individual trucks
The ability to link grade blocks to individual trucks is critical. This relationship needs to be maintained through a Fleet Management System (FMS) or an appropriate data warehouse.
As with any modelling approach, the quality, structure and availability of the data determine how effective the results can be.
Collaborate on 3D ROM stockpile modelling
We are exploring this approach as a potential solution for understanding variability and improving ROM stockpile management. We would welcome mining companies and organisations interested in testing and refining the tool in real operating environments.
If you think it could benefit your operation, or would like to learn more, please get in touch with me or email inquiry@orepath.com.